


%20Data%20in%20GA4.webp)


As we approach the end of Universal Analytics (UA), it's important to address some final considerations. Google Analytics announced months ago that UA will soon be fully deprecated, giving users ample time to save and secure their historical data. If you find yourself needing to export data or are curious about alternative methods, consider trying a manual approach alongside your current export method. There isn't a one-size-fits-all "best" approach for exporting UA data—what matters most is finding the method that best suits your needs and efficiency.
In this blog post, we'll walk you through the conventional method of exporting data using custom reports in your UA interface. Here’s what we’ll cover in this blog post:
- Why Manual Export
- The Pros and Cons of Manual Export
- Manual Export Steps via Custom Report
- Best practices for Manual Export
- Limitations of Manual Export
Why Manual Export:
- It offers flexibility compared to pre-built templates for bulk UA data export. It allows you to choose specific metrics and dimensions, which is useful for analyzing unique data combinations not available in pre-built reports.
- You can customize the date range for data extraction, ensuring you capture the exact timeframe needed, whether for a specific campaign period or historical data set relevant to future analysis.
- It lets you apply filters to focus on specific subsets of data, such as a particular user segment or device type, avoiding unnecessary data downloads.
While you can achieve all of this using the Google Sheets Google Analytics Add-on, as explained in greater detail in this blog post, How to Upload UA Data to GA4, it's reassuring to know that there's another viable option worth exploring.
The Pros and Cons of Manual Export
Here are some of the advantages and disadvantages of going through the manual approach:
Pros:
- Manual export via custom reports allows you to tailor data extraction based on your specific needs and criteria.
- You have direct oversight and can ensure that all necessary data is captured and exported accurately.
- It offers flexibility in choosing the format and structure of exported data, which can be beneficial for different analytical purposes.
Cons:
- Compared to automated exports, manual extraction can be more time-consuming, especially when dealing with large datasets or frequent exports.
- Human error in manual processes could lead to inconsistencies or inaccuracies in exported data.
- It may require additional resources and expertise to manage and execute manual export processes effectively.
Reminder: You should carefully consider the volume of data you need to download, as exporting everything can be time-consuming and may not be necessary. It's important to plan and prioritize your data needs, as discussed in this blog post.
Manual Export Steps via Custom Report
You may already have some familiarity with this process, as it's not new to many of us. However, allow us to provide you with a clear and comprehensive guide from the beginning.
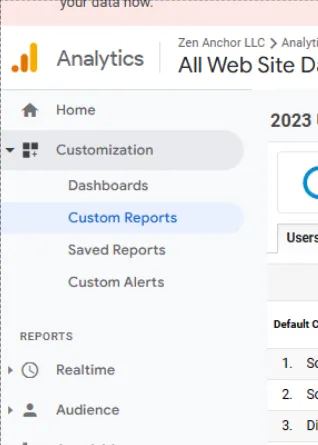
1. Log in to you Universal Analytics account
2. Under Customization > click Custom report
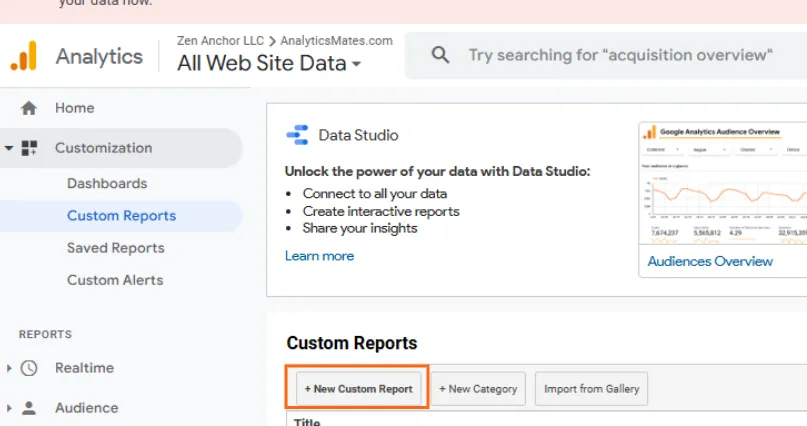
3. On Custom report homepage, click “New Custom Report”.
4. Configure your new custom report
4.a. Give it a good descriptive name, e.g., “UA Historical Data Export - 2023”
4.b. Give a name for the report tab “Users, Sessions and Pageviews by Channel”
4.c. Change type to Flat Table
4.d. You can customize this report by adding dimensions and metrics that you find necessary. In this example, we have included Default Channel Grouping, Month of the Year, and Year as dimensions, and Users, Sessions, and Pageviews as metrics. You also have the option to add filters and select a specific view. Once you're satisfied with your selections, simply click 'Save'.
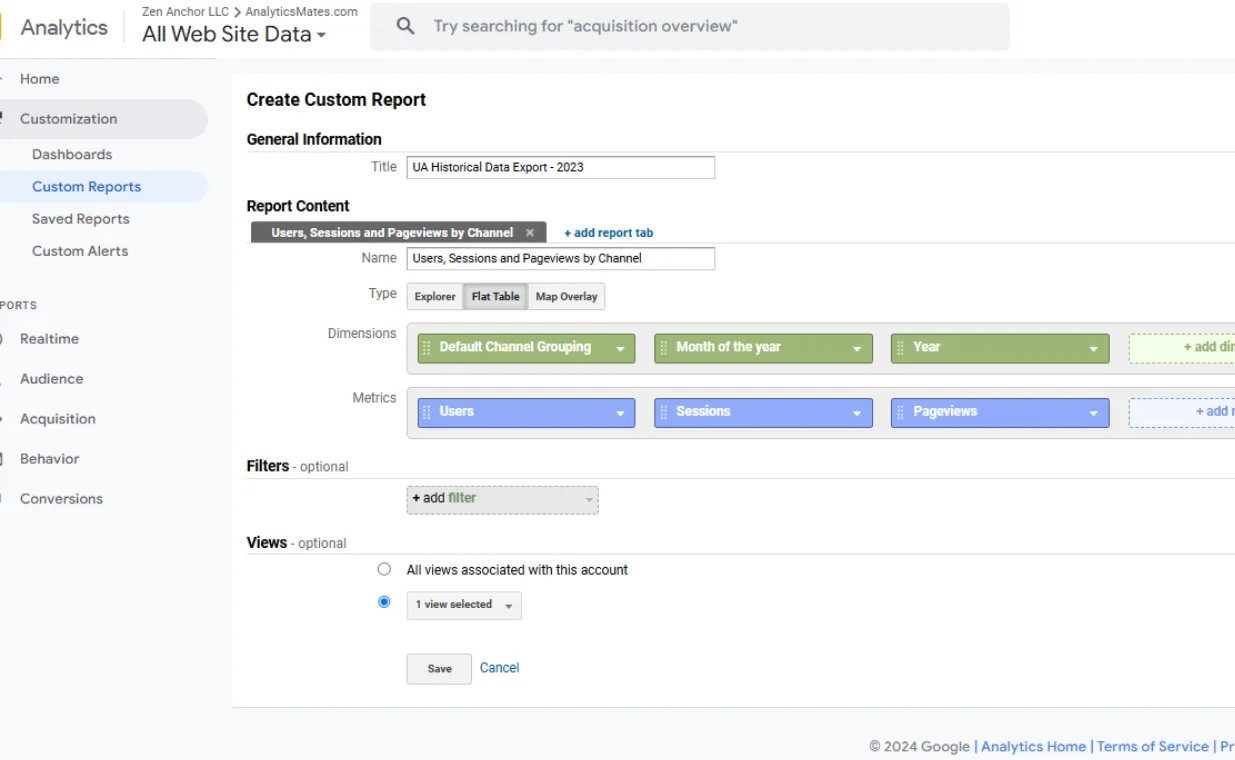
Note: Why are we adding Date dimensions such as Year and Month of the year? The main reason is that you need to associate these data with specific timeframes. While you can drill down to a granular level with specific dates, this can generate an overwhelming amount of data. We recommend aggregating data by months and/or years to keep it manageable and meaningful. This is important!
5. Adjust the date range depending on the data you need.
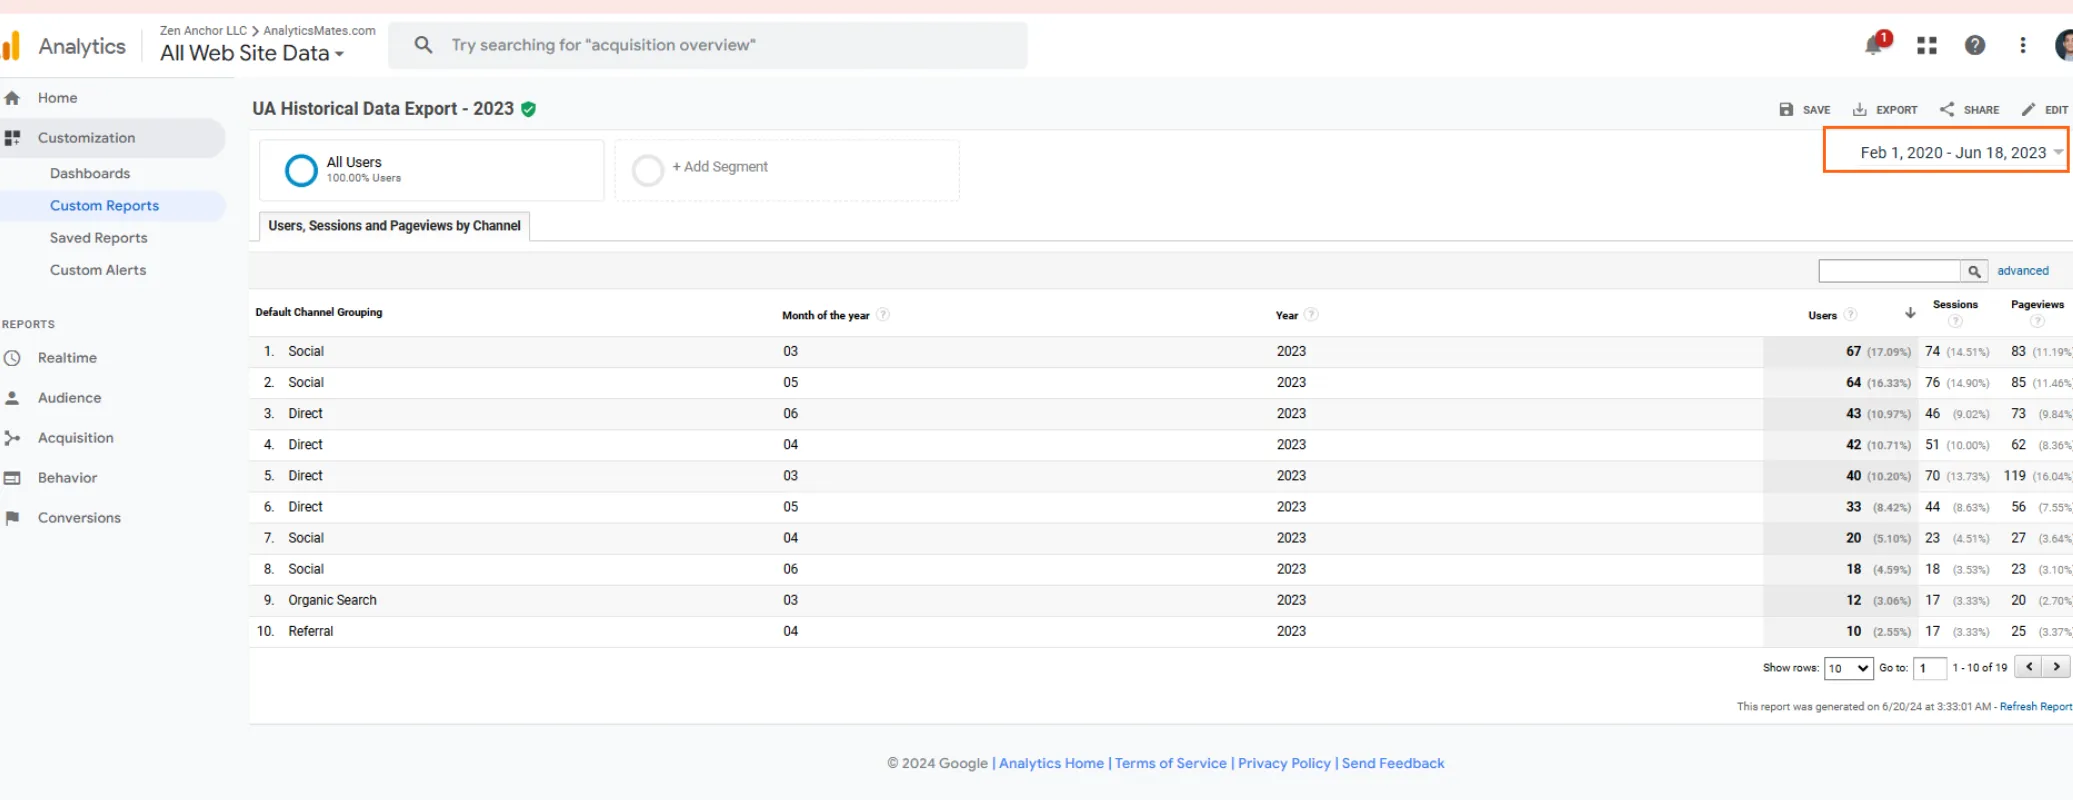
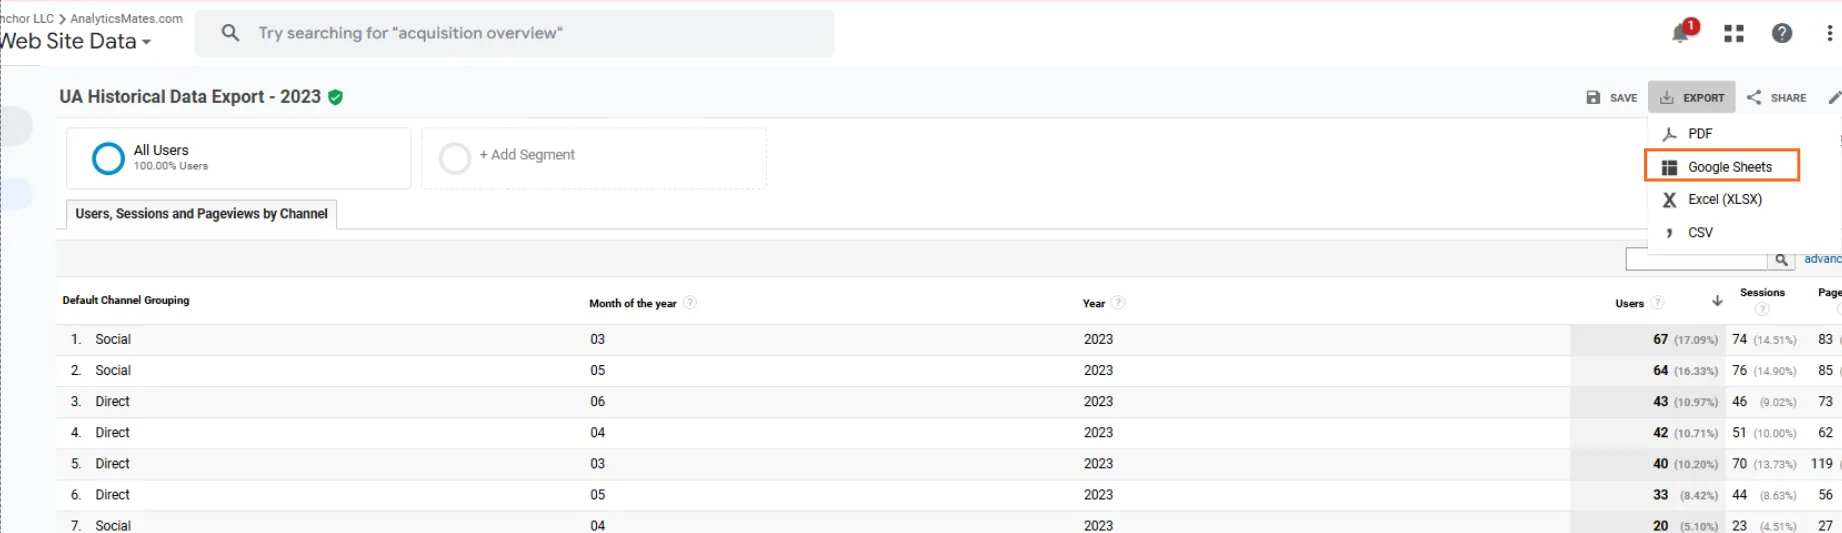
6. When you have selected all the necessary data for export, click on 'Export' located at the top-right corner of the page, and then choose your preferred export destination. In this example, we're exporting to Google Sheets.
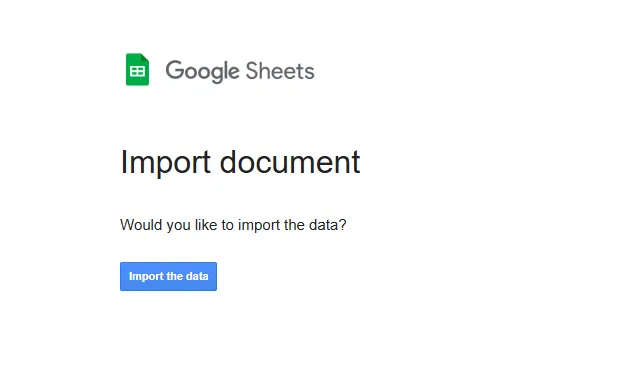
7. You will be prompted with this screen; simply click on 'Import the data'.
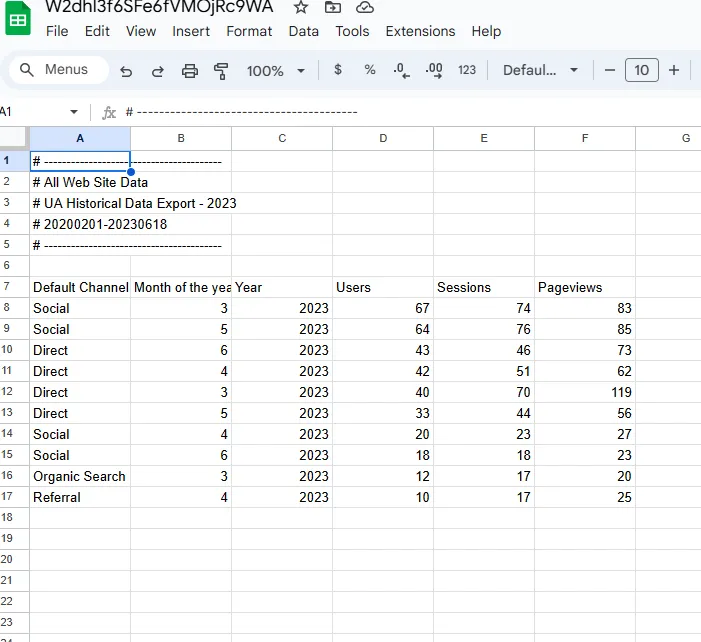
8. Your data will be opened in a new Google Sheet.
And that's it! If you want to avoid the hassle of building everything from scratch, you can use the custom report we've created for your Universal Analytics View.
Best Practices for Manual Export in Universal Analytics
- Clearly outline the specific data sets and metrics you need to export to ensure the export meets your analytical needs.
- Utilize custom reports within Universal Analytics to tailor data extraction based on your specific requirements. This allows you to select relevant dimensions, metrics, and filters.
- Maintain documentation of the steps involved in your manual export process. This documentation should include settings used for custom reports, export formats, and any adjustments made during the process.
- Before finalizing the export, verify the accuracy and completeness of the data. Double-check that the exported data aligns with your expectations and meets quality standards.
- If exporting data to external platforms or tools, ensure secure transmission methods are used to protect data integrity and confidentiality.
Limitations of Manual Export in Universal Analytics
- Manual exports can be time-consuming, especially for large datasets or when frequent updates are required.
- Manual processes are prone to human error, such as incorrect selection of dimensions or filters, which can lead to inaccurate data exports.
- Exporting complex or extensive datasets manually may require significant resources, including time and personnel, to execute effectively.
- Unlike automated exports, manual exports lack automation capabilities, making it less efficient for recurring or scheduled data exports.
- Scaling manual exports to handle increasing data volumes or diverse analytical needs can be challenging without adequate resources and infrastructure.
Final Words
While this may not be the optimal approach, we aim to illustrate that there are alternative options worth exploring. This method offers the same flexibility and control as the Google Sheets add-on. The most crucial step right now is ensuring that your UA data is securely backed up.
Remember, the key takeaway is this: securing your data now lays the foundation for future success.
Thank you for reading!
P.S. We want to emphasize that your exported UA data cannot be directly imported into GA4. There will be times when you'll need to check this exported data for comparison and analysis. While the raw data currently sits in rows and columns, we have developed methods to transform it into a compelling dashboard using Google Looker Studio. We’ve shared a sample dashboard created from the exported UA data and a structured Google Sheet used as a data source for Looker Studio here.
We're always looking for ways to improve our Google Analytics 4 blog content. Please share your feedback so we can make it even better.


