


%20Data%20in%20GA4.webp)


Staying ahead of the eCommerce game requires more than just intuition—it demands data-driven insights. One of the most powerful tools at your disposal is Google Analytics 4 (GA4), which offers robust features for tracking and gaining deep insights into your online store's performance. In this post, we'll walk you through creating a custom report that highlights underperforming products, enabling you to make strategic decisions to boost your revenue.
What You'll Learn
Our custom report will help you answer key questions such as:
- Which products are getting views but no sales?
- Which channels are most effective at driving revenue for specific product categories?
- What products have the highest sales conversion rates?
- How can we identify the best-performing days and hours for sales?
How To Build It
Creating a custom report in GA4 to track product performance is straightforward if you follow these steps:
1. Access the GA4 Property
- Log in to your Google Analytics account.
- Select the GA4 property you want to work with.
2. Navigate to the Reports Section
- On the left-hand menu, click on "Reports."
- Scroll down and click on "Library" at the bottom of the Reports menu. The Library is where you can create and manage custom reports.
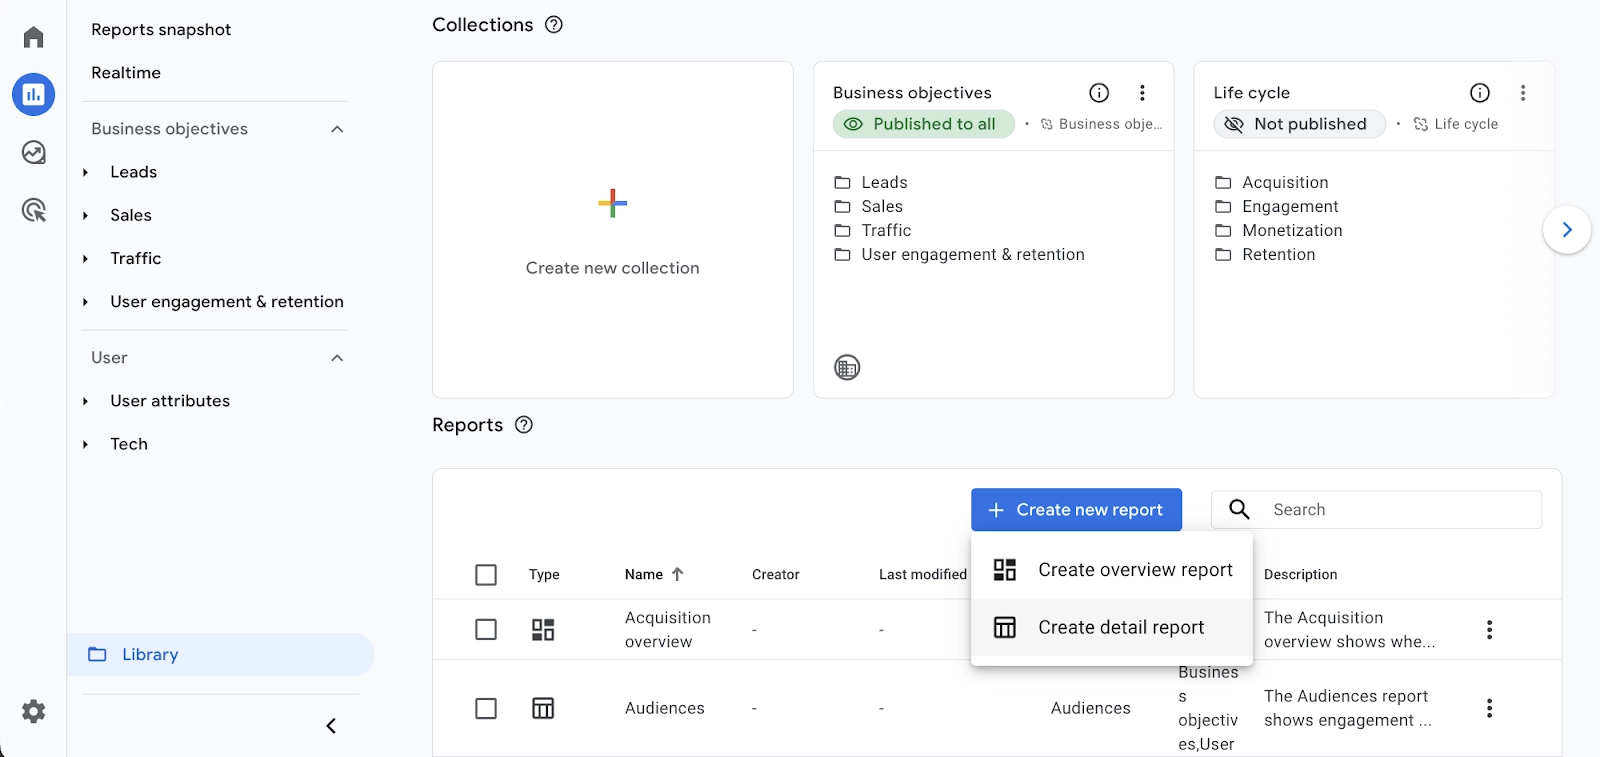
3. Create a New Custom Report
- Click on "Create New Report."
- Choose "Create Detail Report" to start from scratch.
4. Set Up the Report Overview
- Title: Name the report, example: "My Product Performance Report."
- Description: Provide a brief description, such as "This report shows product performance by time and promotional effectiveness, segmented by marketing channels."
- Report Template: Choose the template that best fits your needs or start with a blank template.

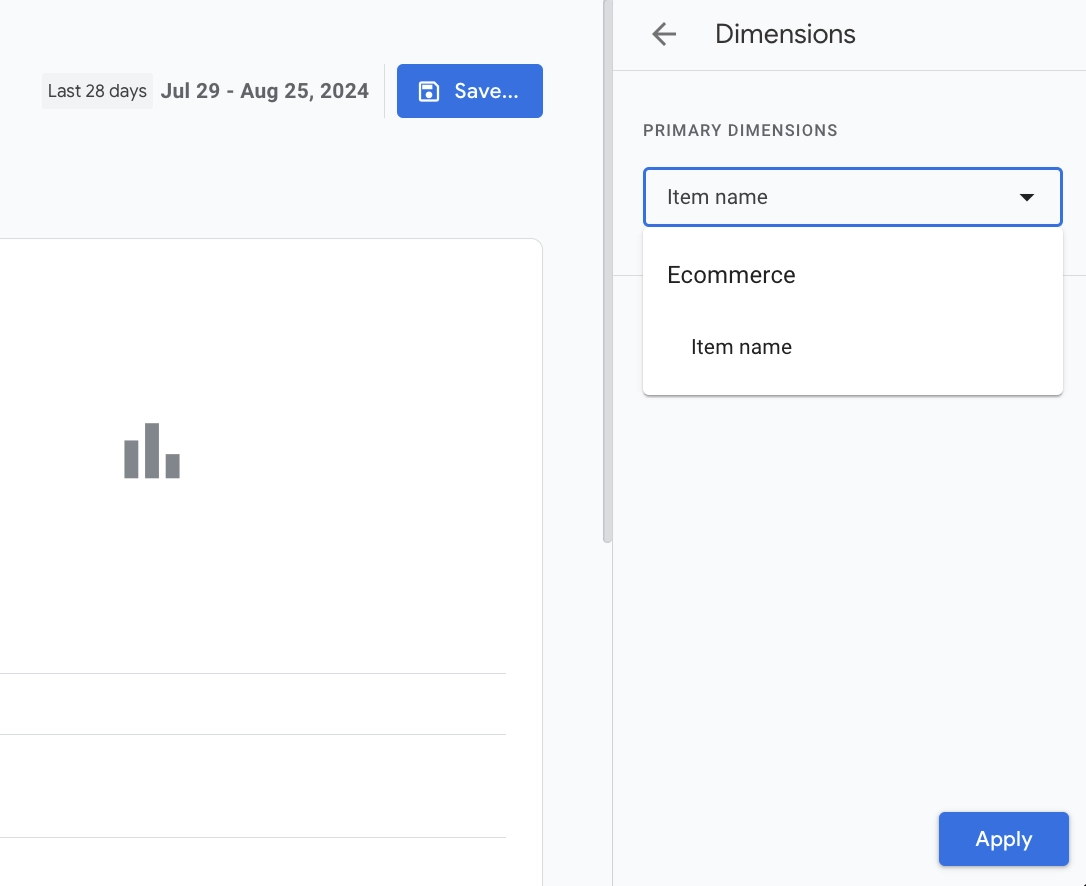
5. Configure Dimensions
- Click on "Dimensions" > "Add Dimension."
- Add the following dimensions:
- Item name
- Item category
- Session source/medium
- Session campaign
- Day
- Hour
6. Configure Metrics
- Click on "Metrics" > "Add Metric."
- Add the following metrics:
- Items viewed
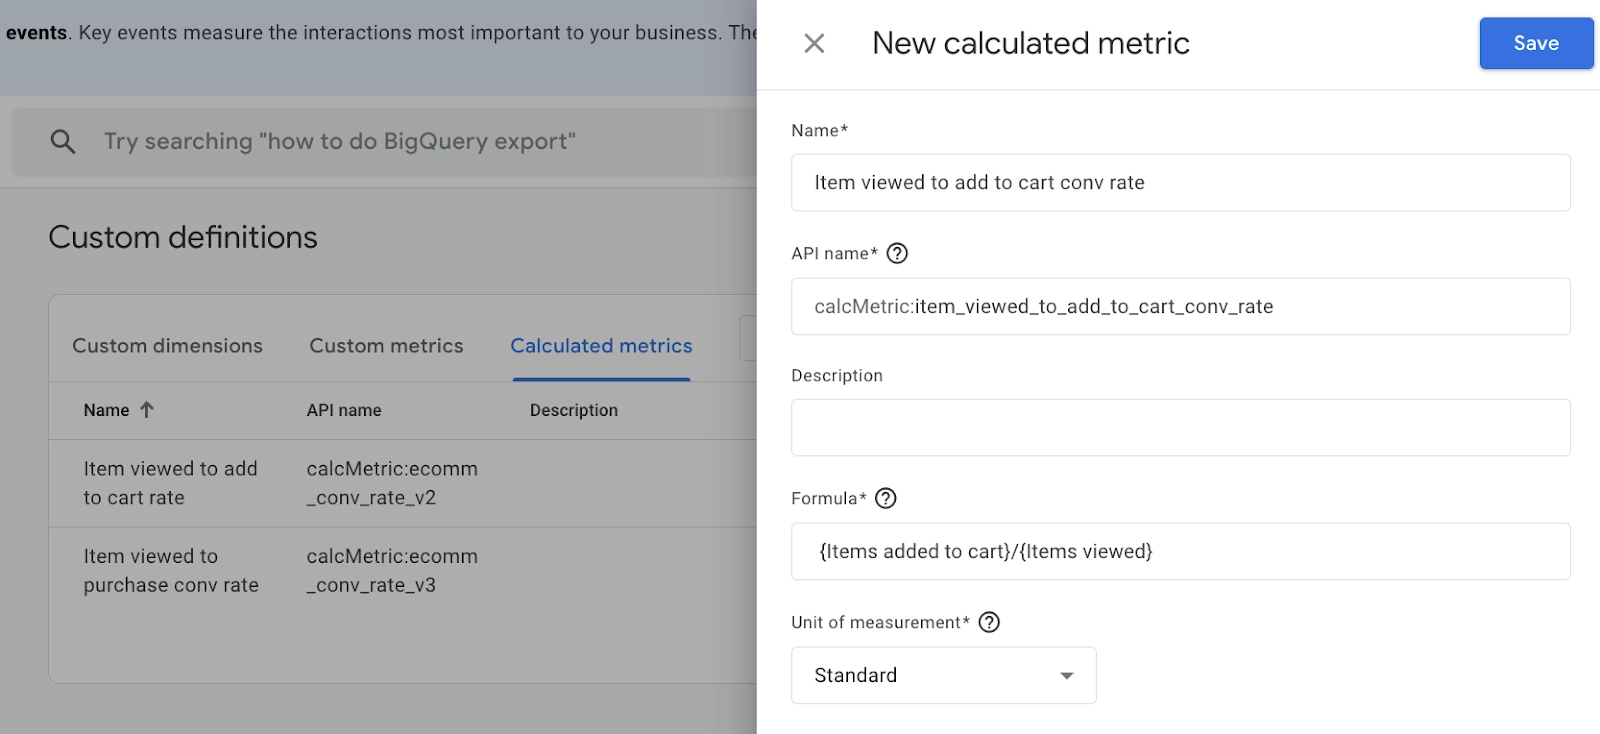
- Items viewed to add to cart conversion rate
- Create this calculated metric by going to "Admin" > click on "Custom definitions" > select "Calculated metrics" tab > click "Create calculated metric" button.
- Give your calculated metric a name > add the formula: {Items added to cart}/{Items viewed}) > and click "Save".
- Items added to cart
- Items viewed to purchase conversion rate
- Create this calculated metric by going to "Admin" > click on "Custom definitions" > select "Calculated metrics" tab > click "Create calculated metric" button.
- Give your calculated metric a name > add the formula: {Items purchased}/{Items viewed}) > and click "Save".
- Items purchased
- Item revenue
7. Set Filters (Optional)
- Apply any necessary filters, such as focusing on specific product categories, campaigns, or date ranges.
8. Configure the Report Layout
- Use a time series chart to visualize product performance over time.
- A table can display detailed data, or use a bar chart to compare performance across different dimensions like Product Category or Source/Medium.
9. Save and Publish the Report
- Click "Save" to keep the report.
- Go back to the Library and find your new report.
- Click "Publish" to make the report available in the main Reports menu for easy access.
10. Add the Report to a Collection
- To make the report easier to find, add it to an existing collection or create a new collection in the GA4 Library.
Pro Tip: Consider setting up email scheduling for regular report delivery to key stakeholders. Why This Report MattersThis Enhanced Product Performance Report is a game-changer for eCommerce businesses. It allows you to:
- Track the performance of new and existing products
- Identify which marketing channels drive the most revenue
- Understand customer behavior patterns
- Make data-driven decisions about inventory and promotions
This enhanced Product Performance Report is just the beginning – use it as a foundation to create even more tailored reports that address your unique business questions and challenges.
We've also recorded a video session to help you better understand the steps to follow in Google Analytics 4 (GA4).
Additional Resources and Next Steps
That wraps up our guide on creating an enhanced Product Performance custom report in Google Analytics 4. With this report, you’ll gain a deeper understanding of how your products perform across various dimensions and timeframes, giving you the insights needed to optimize your marketing and sales strategies.To further enhance your GA4 skills, check out these valuable resources:
To further enhance your GA4 skills, check out these valuable resources:
Creating custom reports in GA4
- Customize GA4 Dashboards: Create New Reports and Collections by ga4.com
- How To Create Custom Reports in Google Analytics 4 Step by Step? By Analytico
Built-in eCommerce reports for Shopify
Important eCommerce Reports in Google Analytics 4(GA4) for Shopify Stores by Analyzify
Video tutorial
Recreating sales performance reports
Step-by-step guide to eCommerce reporting in GA4
Top 5 Custom GA4 Reports with Set Up Instructions
Don't forget to check out more resources on our Analytics Mates blog and YouTube channel, where we cover various topics on Google Analytics 4, Looker Studio, and other essential tools for digital marketers. Start leveraging these GA4 custom reports today and watch your eCommerce strategies evolve and succeed!
Have questions or need further assistance? Don't hesitate to reach out to us at Analytics Mates.


