


In a recent blog post, we explored how Google Analytics 4 (GA4) can be a powerful tool for SEO monitoring, helping both marketers and beginners better understand how to analyze their SEO performance using GA4. While we’ve covered the basics, no discussion about SEO monitoring would be complete without sharing the custom SEO dashboard we’ve built using Google Looker Studio.
In this post, we’ll walk you through how we created our SEO dashboard in Google Looker Studio, which pulls data directly from Google Search Console. Along the way, we discovered that integrating Core Web Vitals insights into the dashboard made it even more powerful. We’re excited to share the entire process with you, so let’s dive in!
Building the SEO Dashboard in Google Looker Studio
If you’re new to Google Looker Studio, this section is for you. If you’re already familiar with the basics, feel free to skip ahead.
Starting Your First Google Looker Studio Dashboard
If you're unsure where to begin, click [this link] to get started with Google Looker Studio. You can explore the platform and try some of the pre-built templates in the Gallery. However, for this guide, we'll start with a blank ‘Report.’
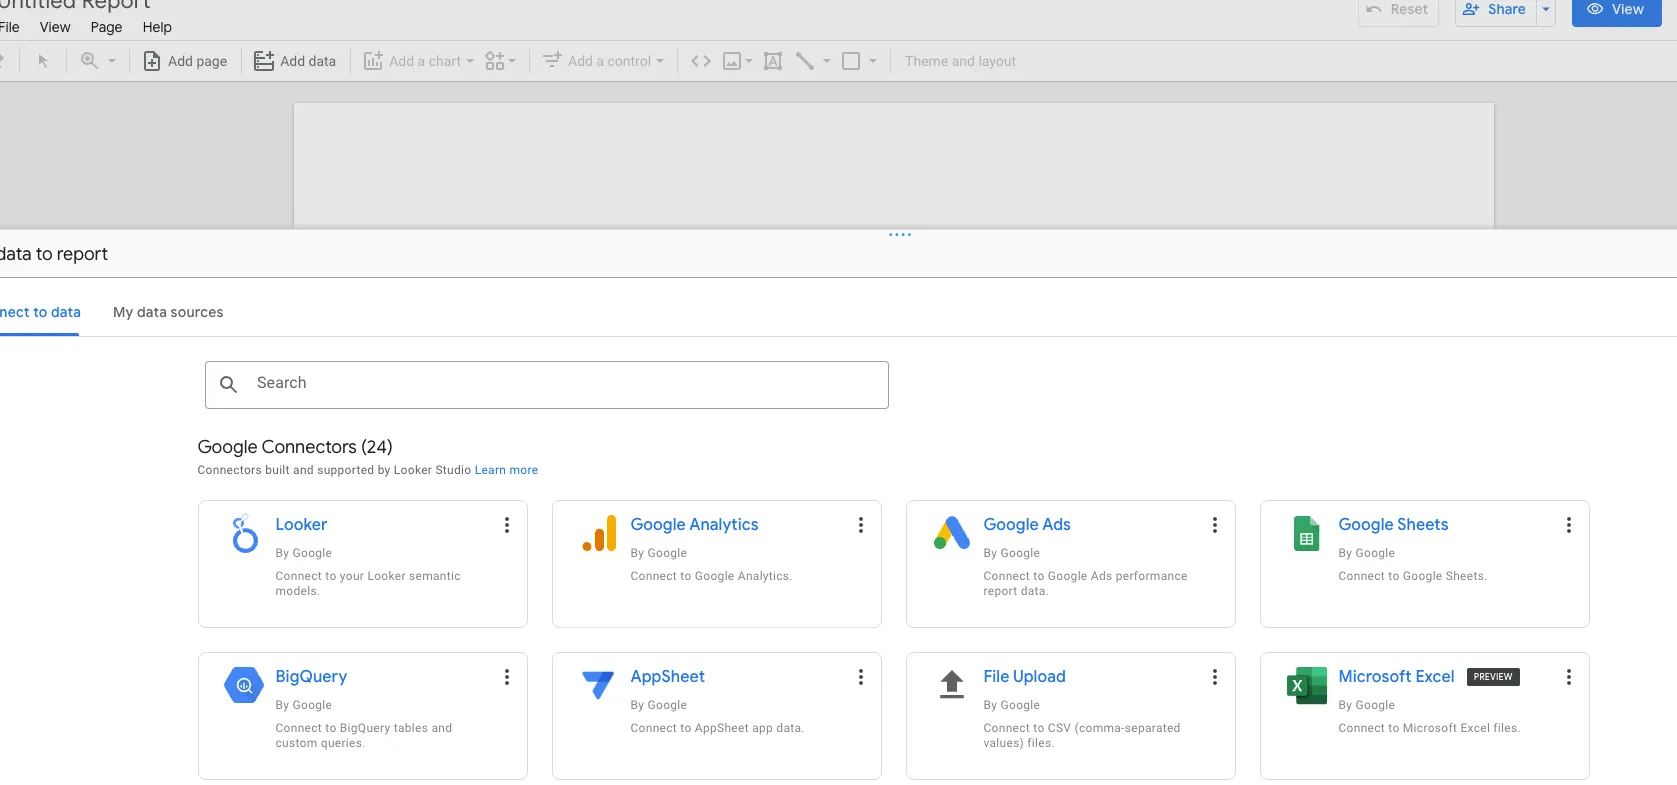
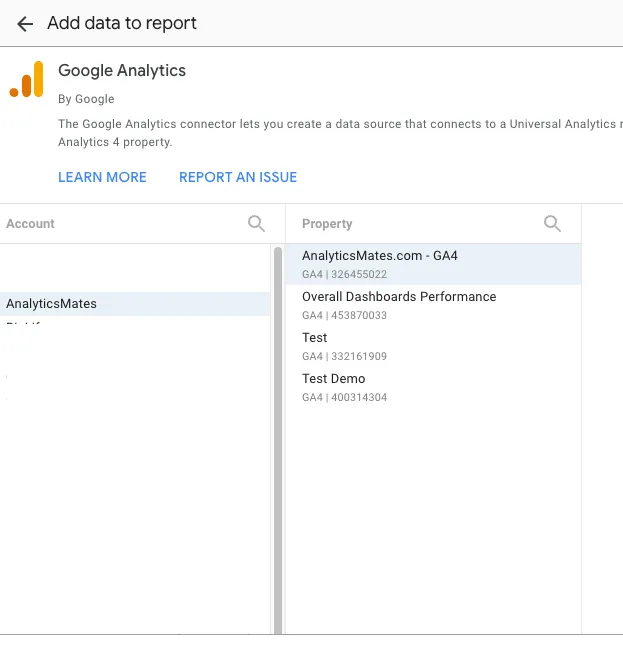
Next, you'll see options to connect to different data sources. For this tutorial, select Google Analytics as your data source.
We won't cover the entire user interface here. If you need a basic overview, you can visit the Google Looker Studio Help Center here. We also offer free templates on our Resources page, which you can download and customize.
Connecting and Using Google Search Console in Looker Studio
Now, let's focus on how to connect and use Google Search Console data in your Looker Studio dashboard. Follow these steps:
- On the Looker Studio homepage, click Create in the top left, then select Data Source.
- Choose the Search Console connector.
- In the Sites panel, select the site you want to connect.
- In the Tables panel, choose either Site Impression or URL Impression.
- In the Search Type panel, select the default search type.
- Click CONNECT in the upper right.
Once connected, the data source fields panel will appear, and your data source will be linked to your dataset.
Building Your Report: Key Dimensions and Metrics
Before diving into report creation, it’s essential to understand the primary dimensions and metrics you’ll need when working with Google Search Console data. Here are the key dimensions and their associated metrics:

There are various ways to set up an SEO dashboard in Looker Studio, but identifying the right data is crucial for building a report that meets your business needs. To make things easier, we've created several templates that you can download for free on our Resources page. Be sure to check them out!
Enhancing the Dashboard with Core Web Vitals
Core Web Vitals are a set of metrics that Google uses to measure the user experience of a website. They focus on Four key aspects: Largest Contentful Paint (LCP), Interaction to Next Paint (INP), Cumulative Layout Shift (CLS) and First Input Delay (FID). While there are other factors to consider, this blog post will concentrate on these three key aspects.
- LCP measures the perceived load speed of a page, indicating how quickly the main content of the page becomes visible to the user.
- INP is a new metric introduced by Google as part of the Core Web Vitals. It measures the responsiveness of a page during user interactions.
- CLS measures the visual stability of a page, indicating how much the page's layout shifts unexpectedly as elements load.
- FID measures the responsiveness of a page, indicating how quickly a user can interact with it after it loads.
Core Web Vitals Scoring Guidelines
Google has provided specific guidelines for interpreting Core Web Vital scores. Here's a breakdown of what constitutes a "good," "needs improvement," and "poor" score for each metric:
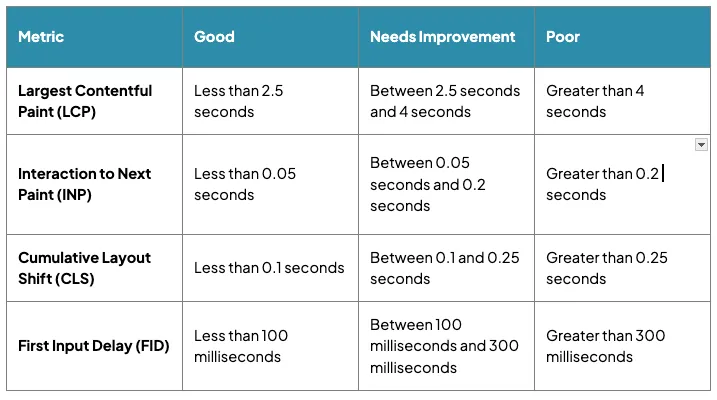
Note: These guidelines are based on real-world user experience studies and are designed to help website owners understand how their pages are performing. It's important to strive for "good" scores for all metrics to provide a positive user experience.
Putting it in a scenario
Imagine you're visiting an online store to purchase a new pair of shoes.
- LCP: When you first load the page, the main image of the shoes takes a long time to appear. This would result in a poor LCP score, as it takes too long for the most important content (the shoe image) to be visible.
- FID: As you try to click the "Add to Cart" button, there's a noticeable delay before the button responds. This would result in a poor FID score, as the page is not responsive to your interaction.
- CLS: As the page loads, elements like images or ads might shift unexpectedly, causing the layout to change. This would result in a poor CLS score, as it can be disorienting and frustrating for the user.
- INP: You try to scroll down the page to see more options, but there's a significant delay before the content appears. This would result in a poor INP score, as the page is not responsive to your scrolling interaction.
However, if the page:
- Loads quickly with the main image visible almost immediately (good LCP)
- Responds promptly when you click the "Add to Cart" button (good FID)
- Maintains a stable layout without any unexpected shifts (good CLS)
- Responds quickly to your scrolling interactions (good INP)
Then you'd have a positive user experience. This positive experience can lead to increased engagement, higher conversion rates, and improved search engine rankings.
How Analytics Mates leverage Core Web Vitals Insights
At Analytics Mates, we've taken the initiative to incorporate Core Web Vitals from the Chrome UX Report as a data source within our SEO dashboard. Go check this out on our Resources page → Analytics Mate SEO Report:Google Search Console + Chrome UX Datasource
If you want to include Core Web Vitals dimensions and metrics in your own SEO dashboard, follow these steps:
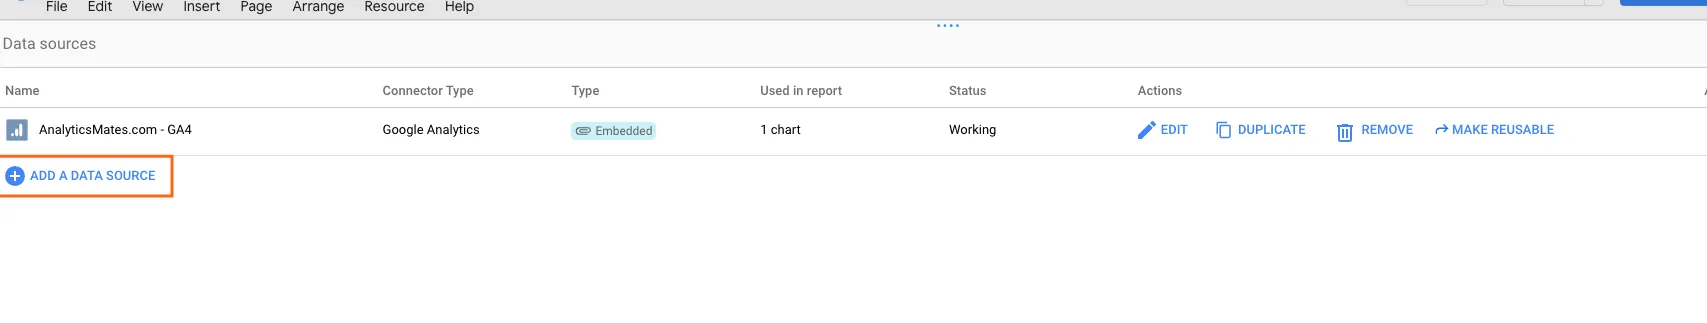
1. Navigate to Resources > Manage added data sources.
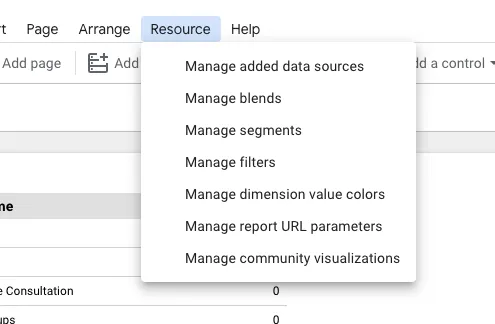
2. Click ADD A DATA SOURCE.
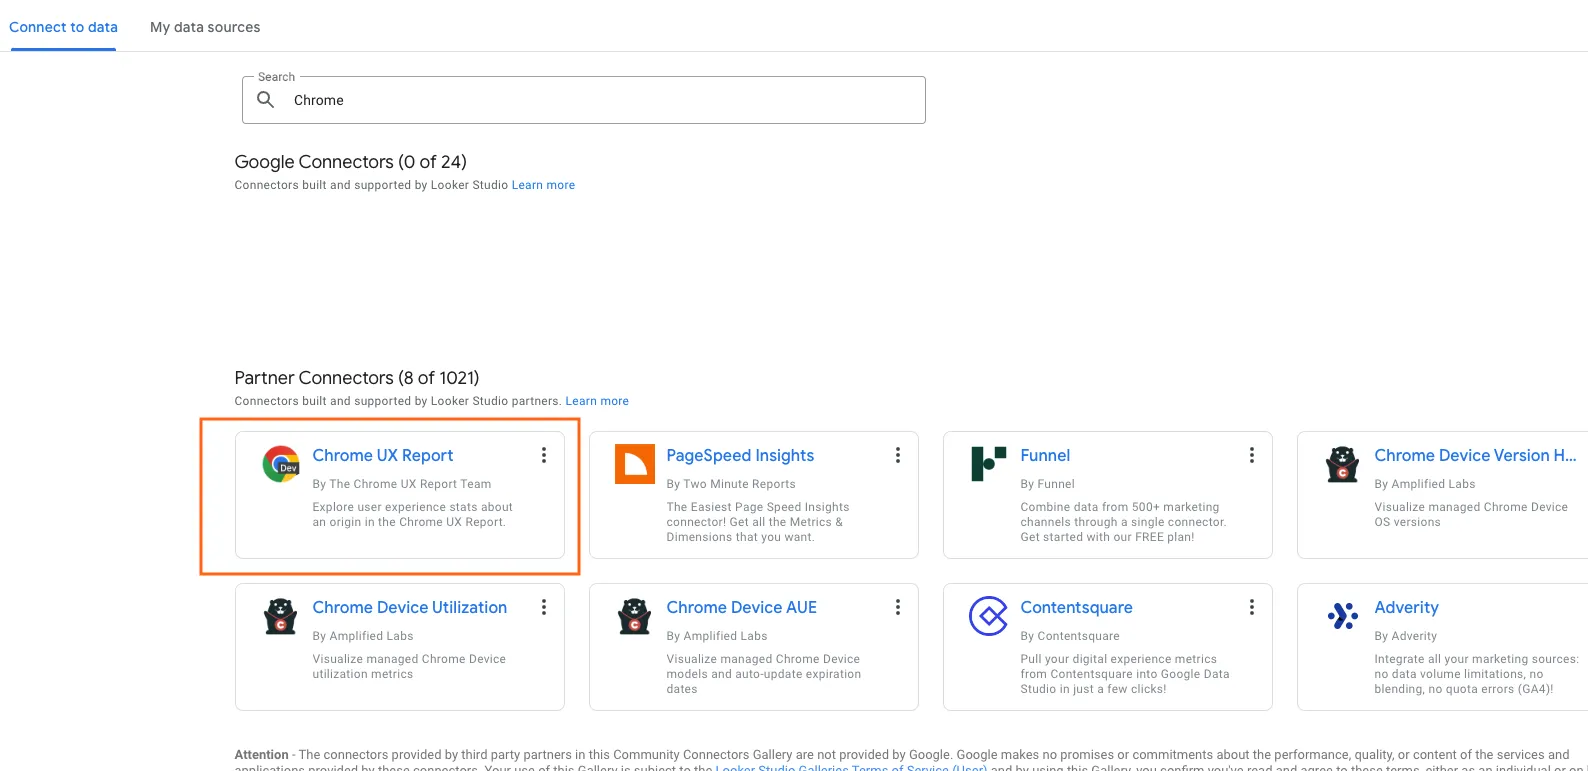
3. Search for Chrome UX Report.
4. Enter your Origin URL. Note: This will only accept the primary domain and may not work for subdomains.some text
5. (Optional) If you want the flexibility to modify the URL later within the report, check the box for “Allow 'Enter origin URL:' to be modified in reports.”
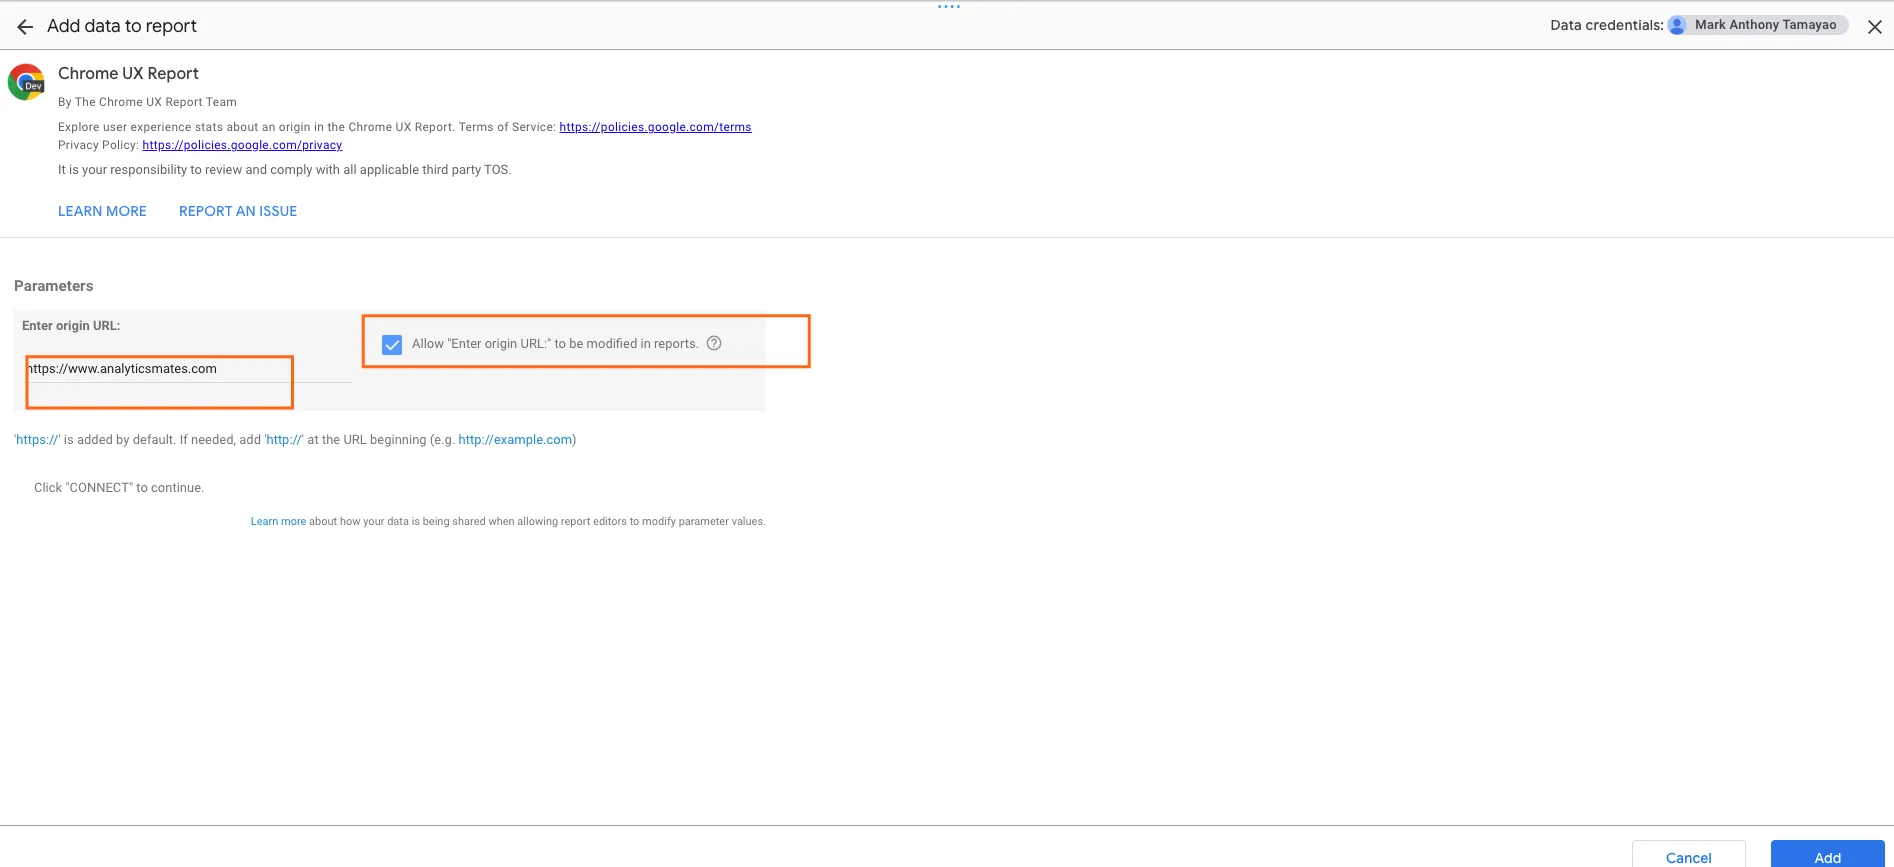
6. Click Add.
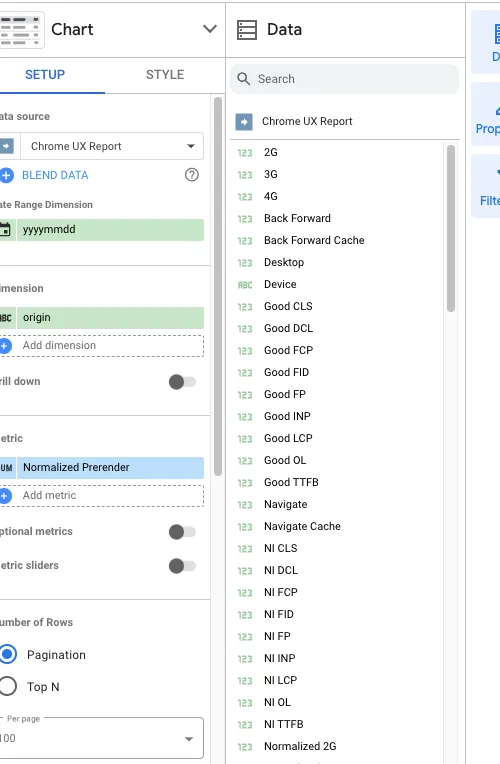
You should now see a list of new dimensions and metrics available for use in your dashboard.
We won’t cover the details of design and how you’ll build the report, as we trust you’ll create it to your exact specifications.
Recommendations for Improving Core Web Vitals
If you're experiencing "needs improvement" or "poor" scores for your Core Web Vitals, here are some common recommendations to help you optimize your website's performance:
Metric: Largest Contentful Paint (LCP)
- Recommendations: Minimize render-blocking resources
- Description: Reduce the number of JavaScript and CSS files that block rendering.
- Resources: Minimize render-blocking resources
- Recommendations: Optimize images
- Description: Compress images without sacrificing quality. Use modern image formats like WebP.
- Resources: Optimize images
- Recommendations: Leverage browser caching
- Description: Enable caching for static assets like images, CSS, and JavaScript to reduce server load.
- Resources: Leverage browser caching
- Recommendations: Improve server response time
- Description: Optimize your server configuration and hosting environment to ensure fast response times.
- Resources: Improve server response time
Metric: First Input Delay (FID)
- Recommendations: Minimize JavaScript execution
- Description: Reduce the amount of JavaScript code that runs on the main thread.
- Resources: Minimize JavaScript execution
- Recommendations: Prioritize rendering tasks
- Description: Ensure that critical rendering tasks are executed before user interactions.
- Resources: Prioritize rendering tasks
- Recommendations: Use web workers
- Description: Offload tasks to web workers to avoid blocking the main thread.
- Resources: Use web workers
Metric: Cumulative Layout Shift (CLS)
- Recommendations: Use fixed-width images and elements
- Description: Avoid using images and elements without specified dimensions, which can cause layout shifts.
- Resources: Use fixed-width images and elements
- Recommendations: Avoid dynamic content insertions
- Description: Minimize the addition of elements to the DOM after the page has initially loaded.
- Resources: Avoid dynamic content insertions
- Recommendations: Reserve space for ads
- Description: If you use ads, reserve space for them upfront to prevent layout shifts when they load.
- Resources: Reserve space for ads
- Recommendations: Optimize fonts
- Description: Use fonts that are pre-loaded or available locally to avoid layout shifts caused by font loading.
- Resources: Optimize fonts
Metric: Interaction to Next Paint (INP)
- Recommendations: Reduce JavaScript bundle size
- Description: Minify and compress JavaScript files to reduce their size.
- Resources: Reduce JavaScript bundle size
- Recommendations: Defer non-critical JavaScript
- Description: Delay the loading of JavaScript that isn't essential for the initial page load.
- Resources: Defer non-critical JavaScript
- Recommendations: Optimize JavaScript execution
- Description: Use techniques like lazy loading and code splitting to improve JavaScript performance.
- Resources: Optimize JavaScript execution
Resources
A lengthy blog post can make it challenging to read and absorb the information. While we aim to provide comprehensive details, our goal is to give you time to digest the key points before exploring further. For more in-depth information about Core Web Vitals and additional recommendations for improving these metrics, please refer to the Google Search Console documentation and Core Web Vitals report .
Final Word
The importance of Core Web Vitals in SEO cannot be overstated. Google has explicitly stated that these metrics are a ranking factor in their search algorithm. Websites with poor Core Web Vitals are likely to rank lower in search results, while those with excellent Core Web Vitals are more likely to rank higher.
Additionally, Core Web Vitals directly impact user experience. Users are more likely to stay on a website that loads quickly, is responsive, and doesn't shift unexpectedly. This can lead to increased user engagement, higher conversion rates, and improved brand reputation.
Finally, we at Analytics Mates believe that incorporating and optimizing Core Web Vitals should be a priority for any website aiming to improve both search engine rankings and overall user satisfaction.We hope this post provides valuable insights to guide your next steps in refining your SEO strategy and help achieve your goals.
Thanks for reading!
We're always looking for ways to improve our Google Analytics 4 blog content. Please share your feedback so we can make it even better.
See Article Images


